> ## Documentation Index
> Fetch the complete documentation index at: https://docs.poly.ai/llms.txt
> Use this file to discover all available pages before exploring further.
# Analyze conversations
> Ask Wren natural-language questions about your agent's conversations and get answers backed by real transcripts.
Ask Wren questions about what's actually happening on your agent's conversations, like *"What are the top escalation reasons?"* or *"Why are calls failing?"*, and it reads real transcripts and metrics to answer.
This replaces **Smart Analyst**, which is being retired. Everything Smart Analyst did, you now do by asking Wren in the normal chat. Your old Smart Analyst chats are still in your [chat history](/wren/chats), read-only.
Wren reviews transcripts and metadata to surface patterns in agent performance, sentiment, and conversation outcomes. Query the previous day or a custom date range.
Analysis works best with **voice** conversations. Webchat and SMS conversations are supported, but some metrics (such as abandoned conversations and message counts) may not surface consistently for non-voice channels.
### What you can ask
* Freeform questions about conversation data
* Top containment blockers and transfer reasons
* Technical issues, drop-offs, and sentiment trends
You don't need a branch, and you don't need edit access. Analysis is read-only, so it's available to anyone who can view conversations or metrics.
## Deep sampling
For questions that need real evidence rather than aggregates, Wren reads the underlying conversations. It analyzes up to **500 conversations** per query, drawn from a window of up to 90 days.
### What you see while it runs
When Wren runs a deep sampling query, the analysis unfolds in real time:
1. **Planning.** Wren shows which steps it will take to answer your question.
2. **Reasoning steps.** Live updates appear as it searches transcripts, queries metrics, or retrieves conversation details.
3. **Sampling progress.** A progress bar tracks how much of the sample has been analyzed.
4. **Final answer.** Once the sample is analyzed, Wren delivers a structured response with its findings.
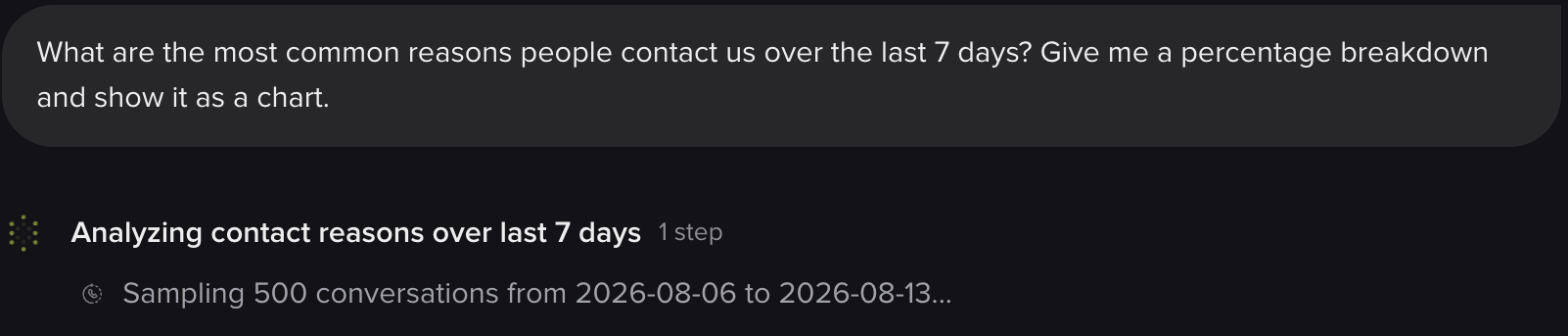 The progress bar counts **batches of 50 conversations**, not individual conversations. A 500-conversation sample moves in 10 steps of 10%.
### How conversations are selected
Wren picks which conversations to read in one of two ways, chosen automatically based on your question:
| Strategy | How it works | Best for |
| ------------ | ----------------------------------------------------------------------------------- | ------------------------------------------------------------------------------------------------ |
| **Random** | Pulls a broad, representative set from the selected time window | General discovery: *"What are customers calling about?"*, *"What are the top complaint themes?"* |
| **Semantic** | Finds conversations similar in meaning to your question, not just matching keywords | Topic-led investigation: *"Find calls where customers were confused about the refund policy"* |
On top of the strategy, you can **narrow the pool** before sampling. Filters include [custom metrics](/analytics/kpis/introduction), [PolyScore](/analytics/polyscore), channel, environment, and date range. This is how you target an investigation:
* *"Why are calls failing the authentication metric?"*
* *"What do low-PolyScore calls have in common?"*
* *"Analyze calls from the last two weeks where customers asked about billing."*
### Time windows
| Setting | Value |
| -------------------- | ------------------------------------------ |
| **Default window** | The last 30 days, if you don't specify one |
| **Maximum lookback** | 90 days |
Ask for something older than 90 days and the window is quietly clamped to the last 90 rather than failing.
### Understanding sample coverage
Wren samples up to **500 conversations** per query. For projects with higher volumes in the selected period, results reflect a representative sample rather than the full dataset. Use these insights to identify trends and patterns, then validate specific findings by reviewing individual conversations in [Conversation Review](/analytics/conversations/review).
For most projects, 500 conversations gives strong directional insight: recurring patterns, common failure modes, behavior frequency. It isn't a substitute for an exhaustive count.
## What the answers look like
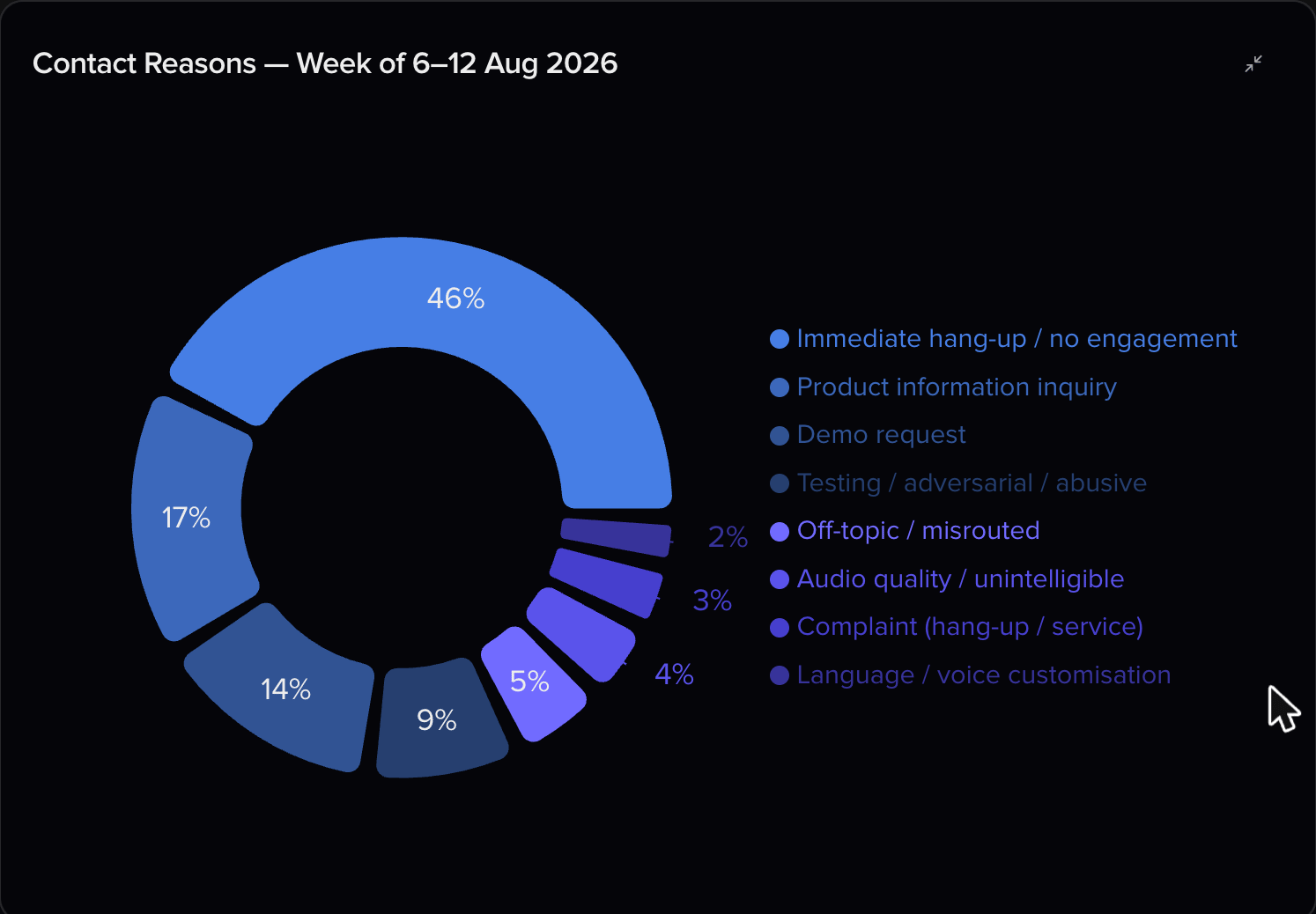
Wren renders its findings inline rather than dumping raw numbers:
* **Charts:** bar, line, pie, radar, and scatter, drawn in the chat. Click to expand any chart.
The progress bar counts **batches of 50 conversations**, not individual conversations. A 500-conversation sample moves in 10 steps of 10%.
### How conversations are selected
Wren picks which conversations to read in one of two ways, chosen automatically based on your question:
| Strategy | How it works | Best for |
| ------------ | ----------------------------------------------------------------------------------- | ------------------------------------------------------------------------------------------------ |
| **Random** | Pulls a broad, representative set from the selected time window | General discovery: *"What are customers calling about?"*, *"What are the top complaint themes?"* |
| **Semantic** | Finds conversations similar in meaning to your question, not just matching keywords | Topic-led investigation: *"Find calls where customers were confused about the refund policy"* |
On top of the strategy, you can **narrow the pool** before sampling. Filters include [custom metrics](/analytics/kpis/introduction), [PolyScore](/analytics/polyscore), channel, environment, and date range. This is how you target an investigation:
* *"Why are calls failing the authentication metric?"*
* *"What do low-PolyScore calls have in common?"*
* *"Analyze calls from the last two weeks where customers asked about billing."*
### Time windows
| Setting | Value |
| -------------------- | ------------------------------------------ |
| **Default window** | The last 30 days, if you don't specify one |
| **Maximum lookback** | 90 days |
Ask for something older than 90 days and the window is quietly clamped to the last 90 rather than failing.
### Understanding sample coverage
Wren samples up to **500 conversations** per query. For projects with higher volumes in the selected period, results reflect a representative sample rather than the full dataset. Use these insights to identify trends and patterns, then validate specific findings by reviewing individual conversations in [Conversation Review](/analytics/conversations/review).
For most projects, 500 conversations gives strong directional insight: recurring patterns, common failure modes, behavior frequency. It isn't a substitute for an exhaustive count.
## What the answers look like
Wren renders its findings inline rather than dumping raw numbers:
* **Charts:** bar, line, pie, radar, and scatter, drawn in the chat. Click to expand any chart.
 * **Tables:** formatted and scrollable.
* **Diagrams:** flow and sequence diagrams when structure is easier to see than describe.
* **Code and data blocks:** with copy and download buttons.
**Conversation IDs are clickable.** Any call ID in an answer opens that conversation's transcript in a side panel, so you can go from a pattern to the evidence without losing your place. Flows, steps, topics, and functions Wren mentions link into Studio the same way.
## Dashboards
For a question you'll ask repeatedly, ask Wren to build a dashboard instead of re-running the query.
Wren can create, edit, preview, publish, and retire **self-serve [dashboards](/analytics/dashboards/introduction)**. They appear as tabs on the Analytics page, alongside the built-in Overview.
* *"Build me a dashboard tracking containment, handoff reasons, and average handling time."*
* *"Add a chart to the containment dashboard breaking handoffs down by hour."*
Chart types include number tiles, line, bar, pie, donut, table, and heatmap. A project can hold up to **10 self-serve dashboards**, each with up to 40 charts.
**Nothing goes live until you publish.** Wren builds into a draft, tests each chart against your real data as it goes, then asks before publishing. Say no and the work is kept as a draft.
* **Tables:** formatted and scrollable.
* **Diagrams:** flow and sequence diagrams when structure is easier to see than describe.
* **Code and data blocks:** with copy and download buttons.
**Conversation IDs are clickable.** Any call ID in an answer opens that conversation's transcript in a side panel, so you can go from a pattern to the evidence without losing your place. Flows, steps, topics, and functions Wren mentions link into Studio the same way.
## Dashboards
For a question you'll ask repeatedly, ask Wren to build a dashboard instead of re-running the query.
Wren can create, edit, preview, publish, and retire **self-serve [dashboards](/analytics/dashboards/introduction)**. They appear as tabs on the Analytics page, alongside the built-in Overview.
* *"Build me a dashboard tracking containment, handoff reasons, and average handling time."*
* *"Add a chart to the containment dashboard breaking handoffs down by hour."*
Chart types include number tiles, line, bar, pie, donut, table, and heatmap. A project can hold up to **10 self-serve dashboards**, each with up to 40 charts.
**Nothing goes live until you publish.** Wren builds into a draft, tests each chart against your real data as it goes, then asks before publishing. Say no and the work is kept as a draft.
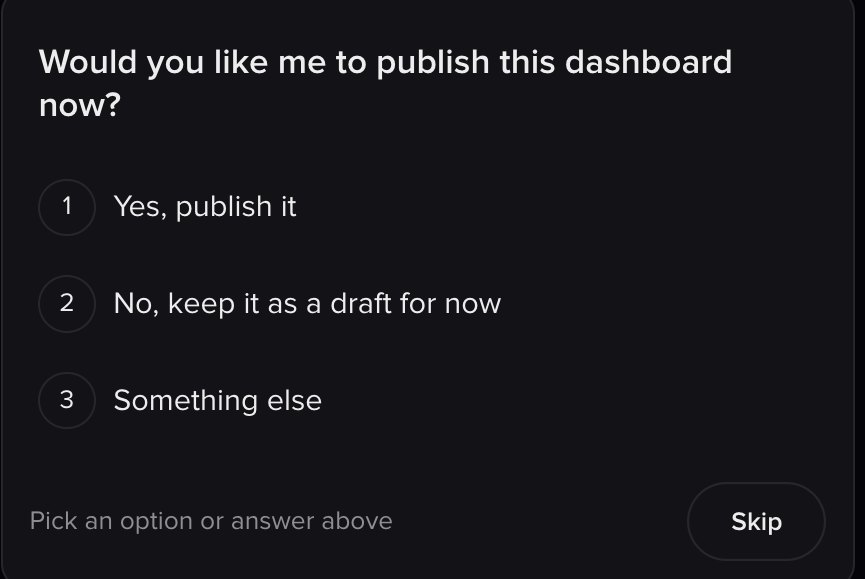 Once published, the dashboard is a tab your whole team can see, with the same channel, environment, and date-range filters as the rest of Analytics.
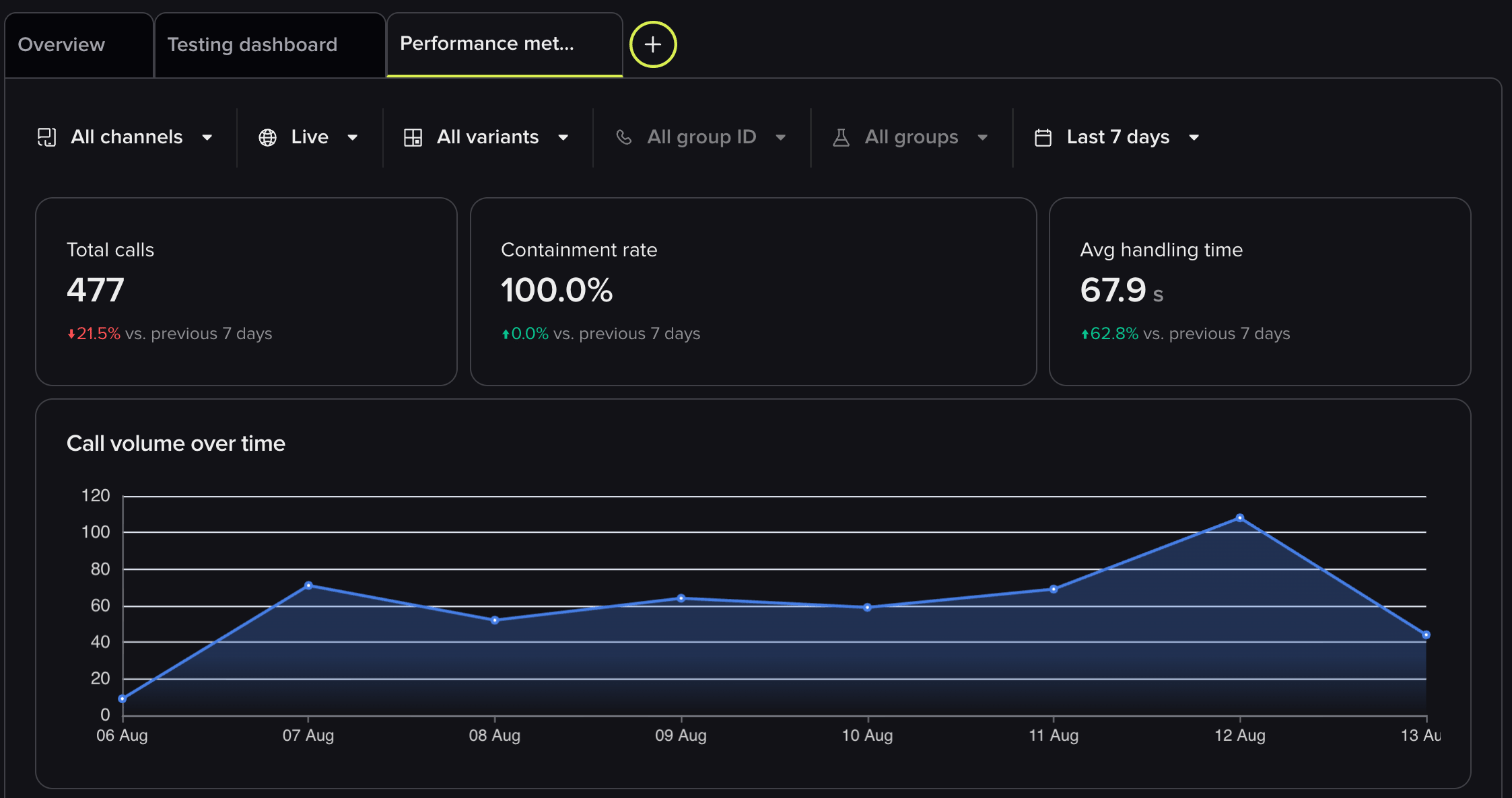 In **Auto** mode Wren will build the dashboard but always leaves it as a draft for you to publish.
Wren manages self-serve dashboards only. Enterprise BI dashboards can't be read or changed from chat.
## Getting better answers
The quality of an answer depends on how well your project is configured and how specific your question is.
### Provide project context
Instead of:
> *"What are the top transfer reasons?"*
Try:
> *"This is a hotel reservation agent. The main goal is containment rate. What are the top reasons calls are transferred to a human agent?"*
If you find yourself repeating the same background in every chat, put it in [project context](/wren/chats#project-context) once instead.
### Ask for percentages explicitly
For precise quantitative breakdowns, include percentage or count-based phrasing:
> *"Please give me the percentage breakdown of transfer reasons."*
This produces more structured, data-driven answers than open-ended narrative questions.
### Use clear, distinct custom metrics
[Custom metrics](/analytics/kpis/introduction) are how you narrow the pool, and Wren sees each metric's name and value on every sampled conversation. Vague or overlapping names lead to noisier samples. Choose names that mean one thing, and make sure the right values are written via `conv.write_metric`.
You can then combine a metric with a natural-language question. If your project has `HANDOFF_REASON`, ask: *"Among calls where HANDOFF\_REASON is 'billing', what patterns do you see in the conversation flow?"* That filters and reads transcripts in one go.
### Use it as a call review starting point
A common workflow is to identify problem areas, then drill into individual conversations:
1. Ask Wren: *"Show me five calls from the last week that couldn't be answered."*
2. Click through to the flagged conversations, or review them in [Conversation Review](/analytics/conversations/review).
3. Use the findings to update your [knowledge](/knowledge/faqs/introduction) or adjust flow logic.
4. Ask Wren to make the fix. You're already in the right chat.
This is especially effective as a daily or weekly optimization routine.
## Example prompts
### Containment and transfers
* *What are the top 5 reasons conversations are transferred to a human agent?*
* *What percentage of calls are contained vs. handed off?*
* *What actions could increase containment for lookup failures?*
### Quality and sentiment
* *Do customers express frustration with the agent?*
* *What types of conversations result in negative sentiment?*
* *Are customers complaining about wait times or hold durations?*
### Conversation analytics
* *Which conversations had the longest average handling time yesterday?*
* *Which intents failed the most often?*
* *What are the most common caller requests this week?*
### Knowledge gaps
* *What kinds of questions are we not handling well?*
* *What information does the agent usually request from callers?*
* *Where does the agent give incorrect or incomplete answers?*
### Domain-specific examples
* *What are the top reasons delivery status lookups fail?* (logistics)
* *How often do callers ask about appointment rescheduling?* (healthcare)
* *What are the most common billing questions?* (utilities / financial services)
* *What drives drop-offs in the reservation flow?* (hospitality)
## Related pages
Drill into individual conversations Wren flags.
Use PolyScore to target analysis at your weakest calls.
Define metrics that improve sampling quality.
In **Auto** mode Wren will build the dashboard but always leaves it as a draft for you to publish.
Wren manages self-serve dashboards only. Enterprise BI dashboards can't be read or changed from chat.
## Getting better answers
The quality of an answer depends on how well your project is configured and how specific your question is.
### Provide project context
Instead of:
> *"What are the top transfer reasons?"*
Try:
> *"This is a hotel reservation agent. The main goal is containment rate. What are the top reasons calls are transferred to a human agent?"*
If you find yourself repeating the same background in every chat, put it in [project context](/wren/chats#project-context) once instead.
### Ask for percentages explicitly
For precise quantitative breakdowns, include percentage or count-based phrasing:
> *"Please give me the percentage breakdown of transfer reasons."*
This produces more structured, data-driven answers than open-ended narrative questions.
### Use clear, distinct custom metrics
[Custom metrics](/analytics/kpis/introduction) are how you narrow the pool, and Wren sees each metric's name and value on every sampled conversation. Vague or overlapping names lead to noisier samples. Choose names that mean one thing, and make sure the right values are written via `conv.write_metric`.
You can then combine a metric with a natural-language question. If your project has `HANDOFF_REASON`, ask: *"Among calls where HANDOFF\_REASON is 'billing', what patterns do you see in the conversation flow?"* That filters and reads transcripts in one go.
### Use it as a call review starting point
A common workflow is to identify problem areas, then drill into individual conversations:
1. Ask Wren: *"Show me five calls from the last week that couldn't be answered."*
2. Click through to the flagged conversations, or review them in [Conversation Review](/analytics/conversations/review).
3. Use the findings to update your [knowledge](/knowledge/faqs/introduction) or adjust flow logic.
4. Ask Wren to make the fix. You're already in the right chat.
This is especially effective as a daily or weekly optimization routine.
## Example prompts
### Containment and transfers
* *What are the top 5 reasons conversations are transferred to a human agent?*
* *What percentage of calls are contained vs. handed off?*
* *What actions could increase containment for lookup failures?*
### Quality and sentiment
* *Do customers express frustration with the agent?*
* *What types of conversations result in negative sentiment?*
* *Are customers complaining about wait times or hold durations?*
### Conversation analytics
* *Which conversations had the longest average handling time yesterday?*
* *Which intents failed the most often?*
* *What are the most common caller requests this week?*
### Knowledge gaps
* *What kinds of questions are we not handling well?*
* *What information does the agent usually request from callers?*
* *Where does the agent give incorrect or incomplete answers?*
### Domain-specific examples
* *What are the top reasons delivery status lookups fail?* (logistics)
* *How often do callers ask about appointment rescheduling?* (healthcare)
* *What are the most common billing questions?* (utilities / financial services)
* *What drives drop-offs in the reservation flow?* (hospitality)
## Related pages
Drill into individual conversations Wren flags.
Use PolyScore to target analysis at your weakest calls.
Define metrics that improve sampling quality.