> ## Documentation Index
> Fetch the complete documentation index at: https://docs.poly.ai/llms.txt
> Use this file to discover all available pages before exploring further.
# Standard
> Track call volumes, containment, and performance.
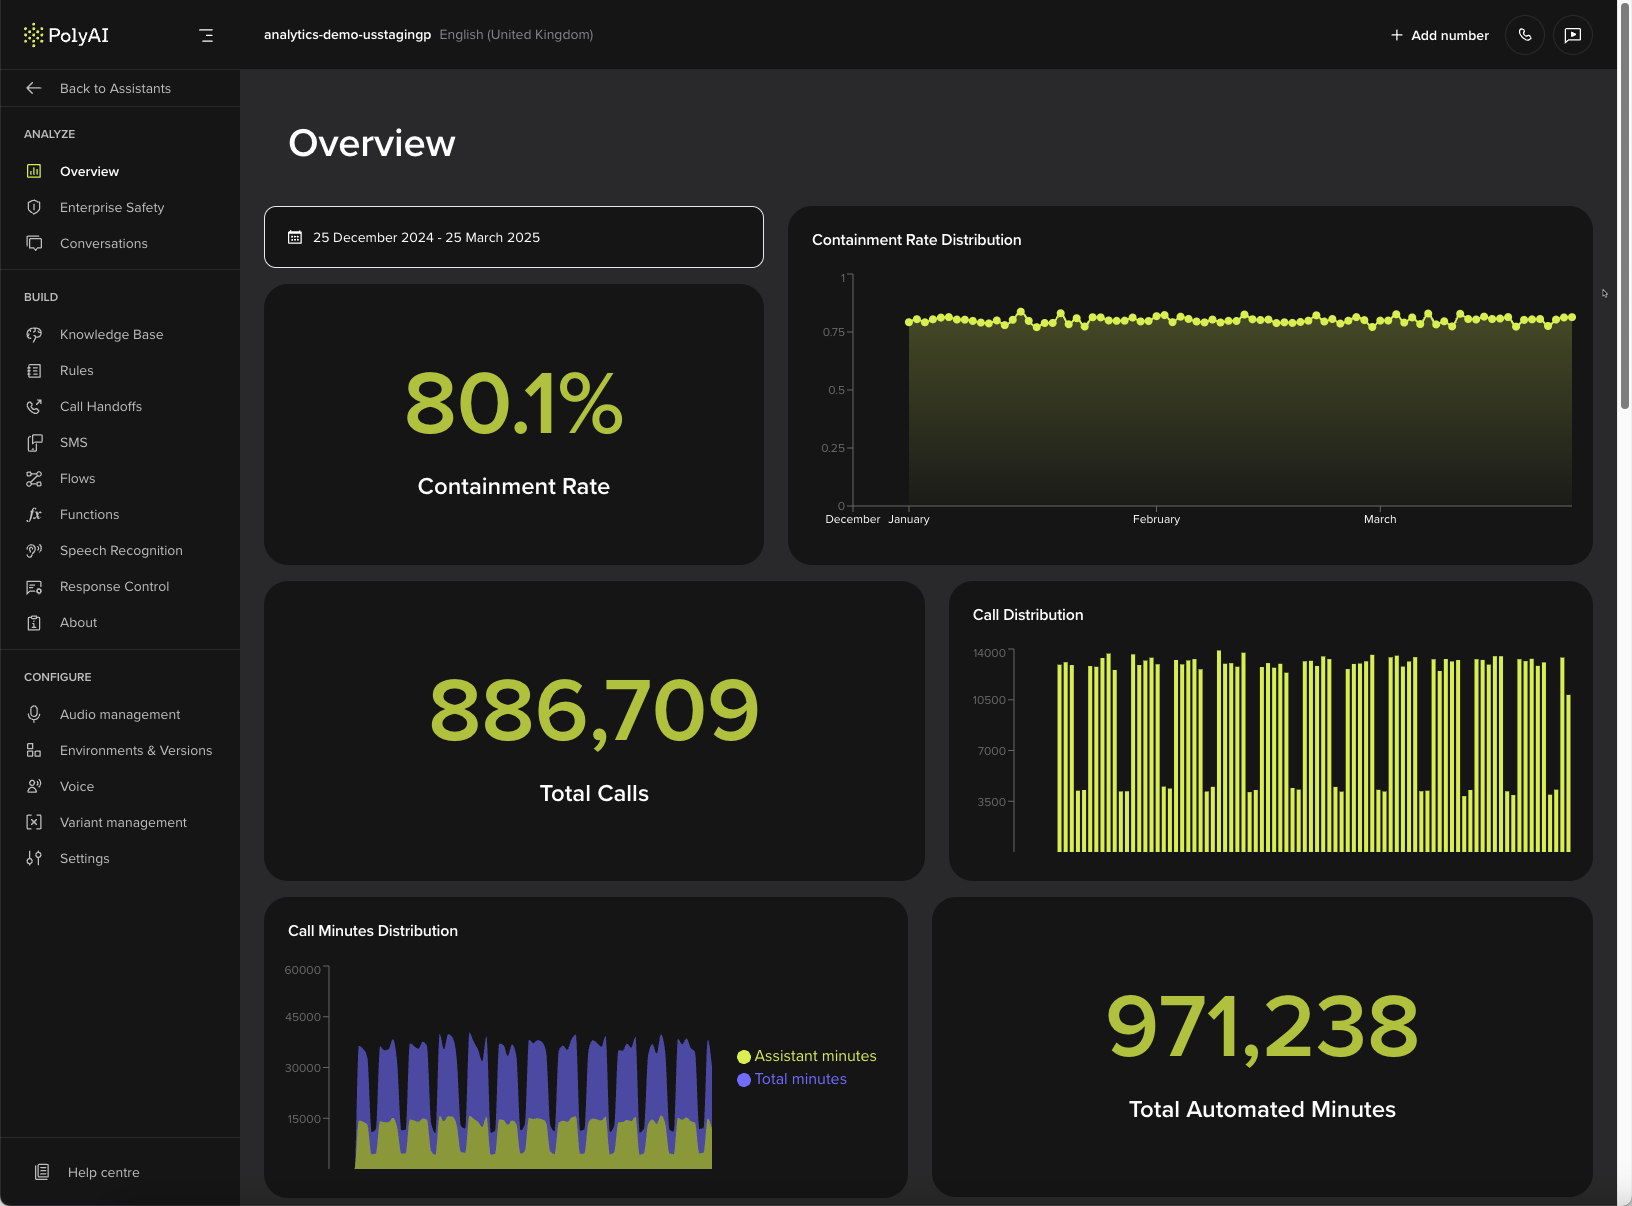
Use the Standard dashboard for day-to-day performance monitoring – call volume, containment rate, average duration, and function/SMS usage. Check it daily or weekly to spot trends before they become problems.
 ## Key metrics
| Metric | What it tells you |
| --------------------------- | ----------------------------------------------------------------------- |
| **Containment rate** | Percentage of calls handled entirely by the agent without human handoff |
| **Total calls** | Number of calls processed in the selected date range |
| **Total automated minutes** | Total duration of calls handled by the agent |
| **Average call duration** | Average length of calls in seconds |
## Visualized metrics
### Containment rate distribution
Shows how the containment rate has fluctuated over time.
### Call distribution
Displays the number of calls received each day within the selected period.
### Call minutes distribution
Compares total call duration with the time actively handled by the agent.
### Average call duration distribution
Illustrates variations in the average length of calls over time.
### Average words per conversation by date
Tracks the number of words exchanged per conversation over time.
* **Overall average words per call**:
* **Agent words**: The proportion of words spoken by the agent.
* **Caller words**: The proportion of words spoken by the user.
## Tool calls & SMS metrics
### Tool calls & SMS rates
* **Tool calls per day**: The frequency of [tool calls](/tools/introduction) triggered by the agent.
* **% of tool calls from total calls**: The proportion of calls that included tool executions.
* **% of SMS sent from total calls**: The percentage of calls where an SMS was sent as part of the interaction.
### SMS sent vs failed
Shows the number of [SMS](/voice-channel/message-templates) messages successfully sent compared to failed delivery attempts.
### SMS topic breakdown
Categorizes SMS messages based on their content or purpose.
## API performance metrics
### API availability & performance
* **Total API requests sent**: The number of API calls made by the agent to external systems.
* **API latency (ms)**: The average response time for API requests, measured in milliseconds.
* **API performance and failure insights**: Highlights trends in API responsiveness and any failures that may impact call handling.
## Related pages
Monitor flagged conversations, risky utterances, and content safety filter performance.
Enterprise dashboards tailored to your specific metrics and business outcomes.
Define custom metrics that flow into dashboards and Smart Analyst.
## Key metrics
| Metric | What it tells you |
| --------------------------- | ----------------------------------------------------------------------- |
| **Containment rate** | Percentage of calls handled entirely by the agent without human handoff |
| **Total calls** | Number of calls processed in the selected date range |
| **Total automated minutes** | Total duration of calls handled by the agent |
| **Average call duration** | Average length of calls in seconds |
## Visualized metrics
### Containment rate distribution
Shows how the containment rate has fluctuated over time.
### Call distribution
Displays the number of calls received each day within the selected period.
### Call minutes distribution
Compares total call duration with the time actively handled by the agent.
### Average call duration distribution
Illustrates variations in the average length of calls over time.
### Average words per conversation by date
Tracks the number of words exchanged per conversation over time.
* **Overall average words per call**:
* **Agent words**: The proportion of words spoken by the agent.
* **Caller words**: The proportion of words spoken by the user.
## Tool calls & SMS metrics
### Tool calls & SMS rates
* **Tool calls per day**: The frequency of [tool calls](/tools/introduction) triggered by the agent.
* **% of tool calls from total calls**: The proportion of calls that included tool executions.
* **% of SMS sent from total calls**: The percentage of calls where an SMS was sent as part of the interaction.
### SMS sent vs failed
Shows the number of [SMS](/voice-channel/message-templates) messages successfully sent compared to failed delivery attempts.
### SMS topic breakdown
Categorizes SMS messages based on their content or purpose.
## API performance metrics
### API availability & performance
* **Total API requests sent**: The number of API calls made by the agent to external systems.
* **API latency (ms)**: The average response time for API requests, measured in milliseconds.
* **API performance and failure insights**: Highlights trends in API responsiveness and any failures that may impact call handling.
## Related pages
Monitor flagged conversations, risky utterances, and content safety filter performance.
Enterprise dashboards tailored to your specific metrics and business outcomes.
Define custom metrics that flow into dashboards and Smart Analyst.