> ## Documentation Index
> Fetch the complete documentation index at: https://docs.poly.ai/llms.txt
> Use this file to discover all available pages before exploring further.
# Dashboards
> Analyze agent performance with dashboards.
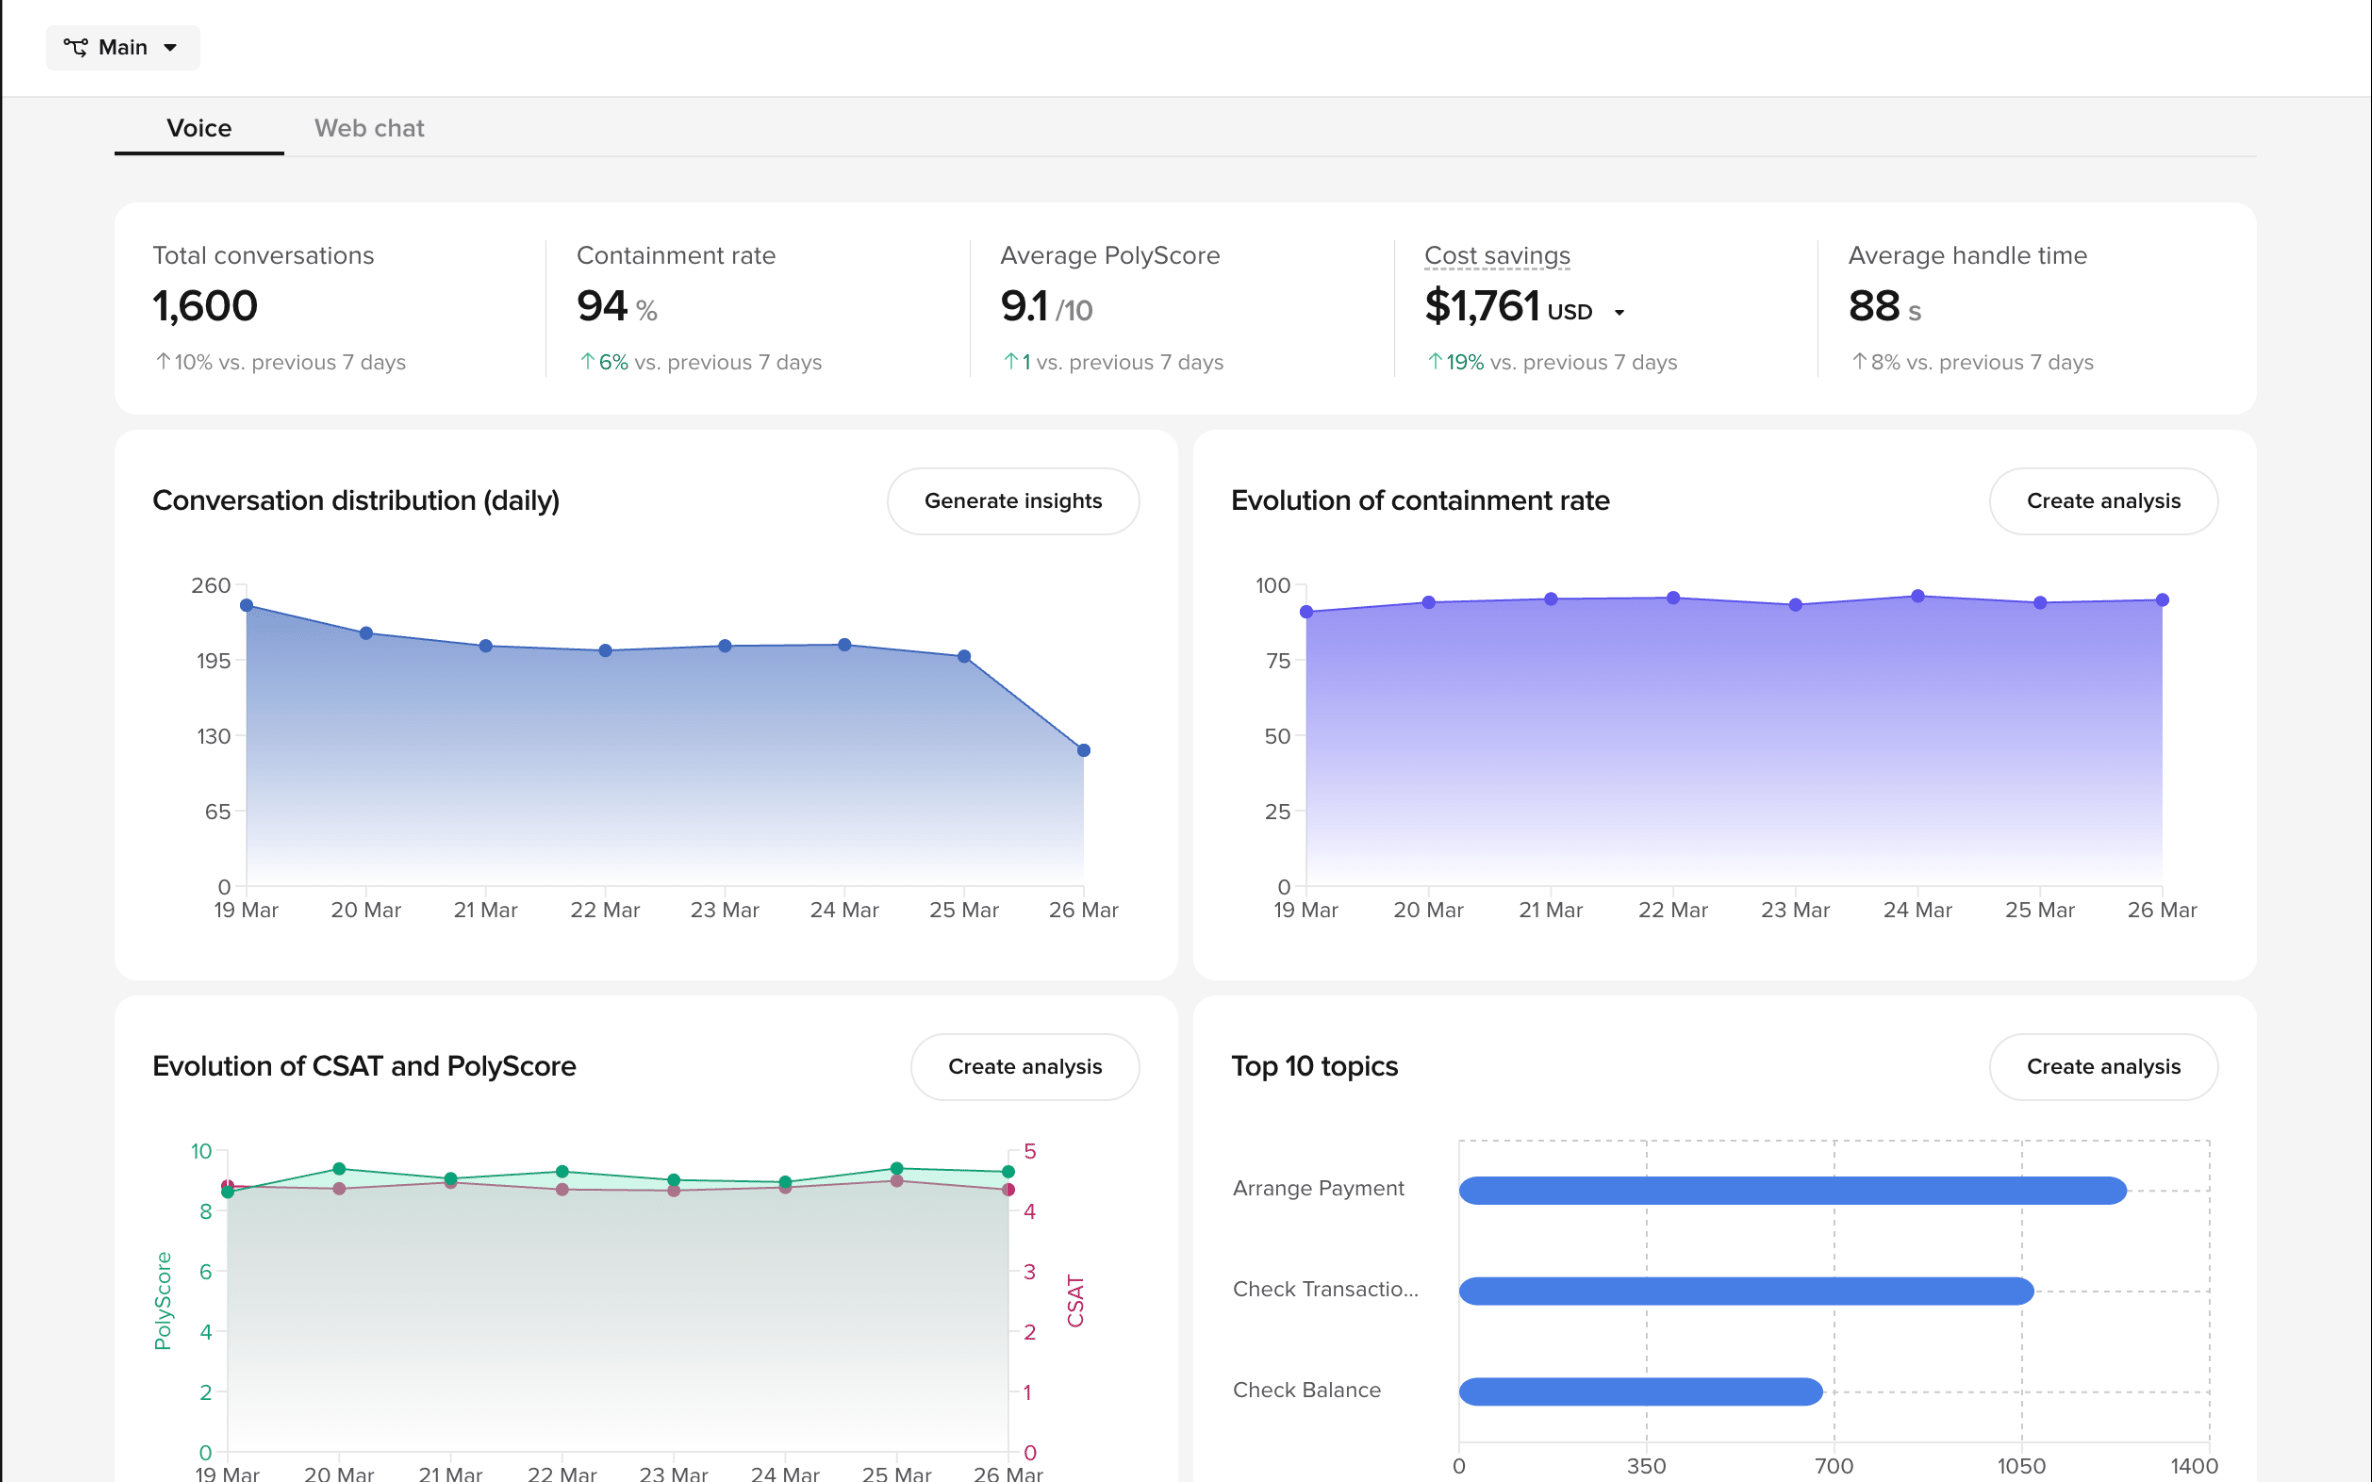
Visual overview of agent performance – call volume, containment, safety, and business-specific metrics.
 For quick workflows using dashboards, see [QA and analytics](/learn/maintain/qa-analytics). For in-depth performance analysis, see [Performance monitoring](/learn/maintain/performance-monitoring).
## Smart Analyst integration
Each chart has **Generate insights** and **Create analysis** buttons that open [Smart Analyst](/smart-analyst/introduction) with a pre-populated prompt based on that chart's data.
## When to use each dashboard
| Dashboard | Best for | Key metrics |
| -------------------------- | -------------------------------------- | ----------------------------------------------------------------------------------------------------------------------------------------- |
| **[Standard](./standard)** | Day-to-day performance monitoring | Containment rate, call volume, average duration, call outcome breakdowns (contained, handoff, abandoned, error). |
| **[Safety](./safety)** | Compliance audits and risk monitoring | Flagged conversations, caller risk levels, content category breakdowns (hate, self-harm, violence). Includes filter configuration. |
| **[Custom](./custom)** | Business-specific metrics (enterprise) | Any metric tailored to your use case – booking conversions, revenue impact, custom function metrics. Built with your PolyAI account team. |
Start with **Standard**. Add **Safety** if you handle sensitive content. Request **Custom** for business-specific metrics.
## Dashboard types
Track call volumes, containment rates, average duration, function usage, and SMS metrics across your agent.
Monitor flagged conversations, risky user utterances, and the performance of content safety filters.
Enterprise dashboards tailored to your specific metrics and business outcomes.
## Related pages
Drill into individual calls behind your dashboard metrics
Investigate trends with natural-language queries
Define the metrics that power your dashboards
For quick workflows using dashboards, see [QA and analytics](/learn/maintain/qa-analytics). For in-depth performance analysis, see [Performance monitoring](/learn/maintain/performance-monitoring).
## Smart Analyst integration
Each chart has **Generate insights** and **Create analysis** buttons that open [Smart Analyst](/smart-analyst/introduction) with a pre-populated prompt based on that chart's data.
## When to use each dashboard
| Dashboard | Best for | Key metrics |
| -------------------------- | -------------------------------------- | ----------------------------------------------------------------------------------------------------------------------------------------- |
| **[Standard](./standard)** | Day-to-day performance monitoring | Containment rate, call volume, average duration, call outcome breakdowns (contained, handoff, abandoned, error). |
| **[Safety](./safety)** | Compliance audits and risk monitoring | Flagged conversations, caller risk levels, content category breakdowns (hate, self-harm, violence). Includes filter configuration. |
| **[Custom](./custom)** | Business-specific metrics (enterprise) | Any metric tailored to your use case – booking conversions, revenue impact, custom function metrics. Built with your PolyAI account team. |
Start with **Standard**. Add **Safety** if you handle sensitive content. Request **Custom** for business-specific metrics.
## Dashboard types
Track call volumes, containment rates, average duration, function usage, and SMS metrics across your agent.
Monitor flagged conversations, risky user utterances, and the performance of content safety filters.
Enterprise dashboards tailored to your specific metrics and business outcomes.
## Related pages
Drill into individual calls behind your dashboard metrics
Investigate trends with natural-language queries
Define the metrics that power your dashboards