> ## Documentation Index
> Fetch the complete documentation index at: https://docs.poly.ai/llms.txt
> Use this file to discover all available pages before exploring further.

# Overview

> Inspect individual conversations to debug agent behavior and audit call quality.

<div className="simplified-only">
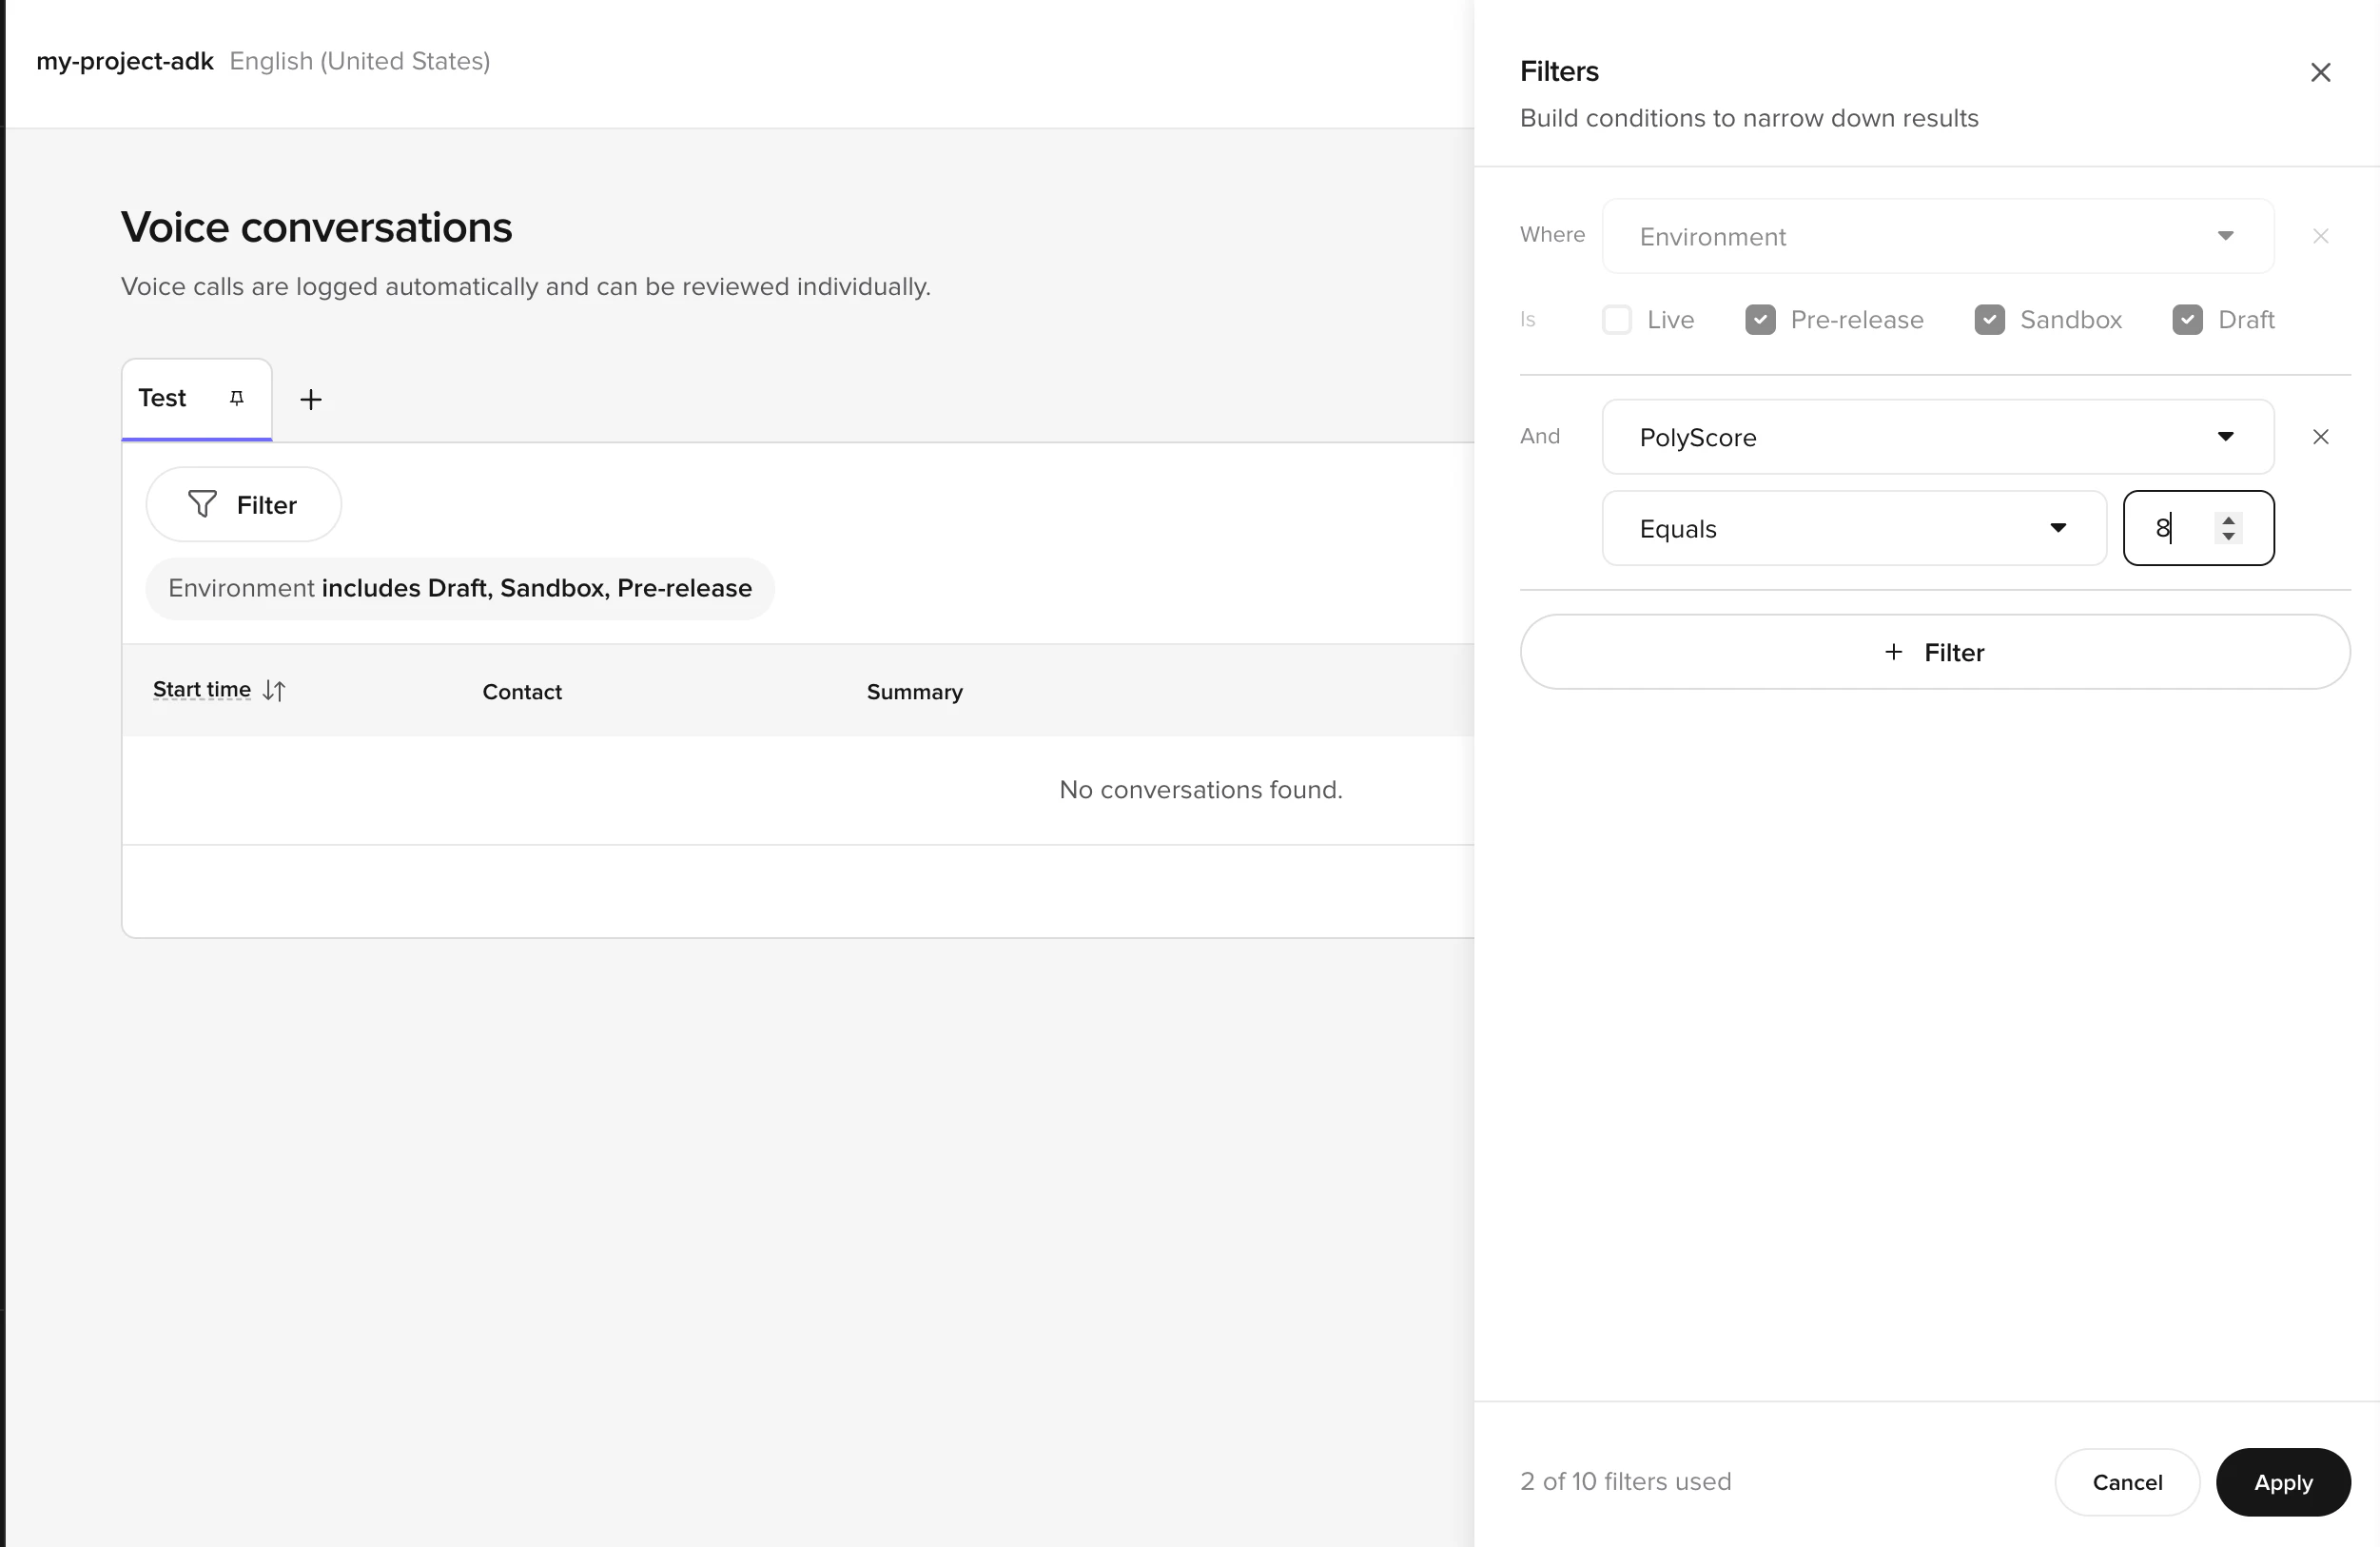
  <Frame caption="Voice conversations page with an environment filter chip, a Filters side panel for building further conditions, and a Start time / Contact / Summary table">
    <img src="https://mintcdn.com/polyai/3x0H8UF7m563JYpi/images/analytics/op-voice-conversations.png?fit=max&auto=format&n=3x0H8UF7m563JYpi&q=85&s=545fcab4fe871f0e2ebd227adf05eb28" alt="Voice conversations page with an environment filter chip, a Filters side panel for building further conditions, and a Start time / Contact / Summary table" style={{ maxWidth: '720px', width: '100%', margin: '0 auto', display: 'block' }} width="2502" height="1626" data-path="images/analytics/op-voice-conversations.png" />
  </Frame>
</div>

<div className="full-only">
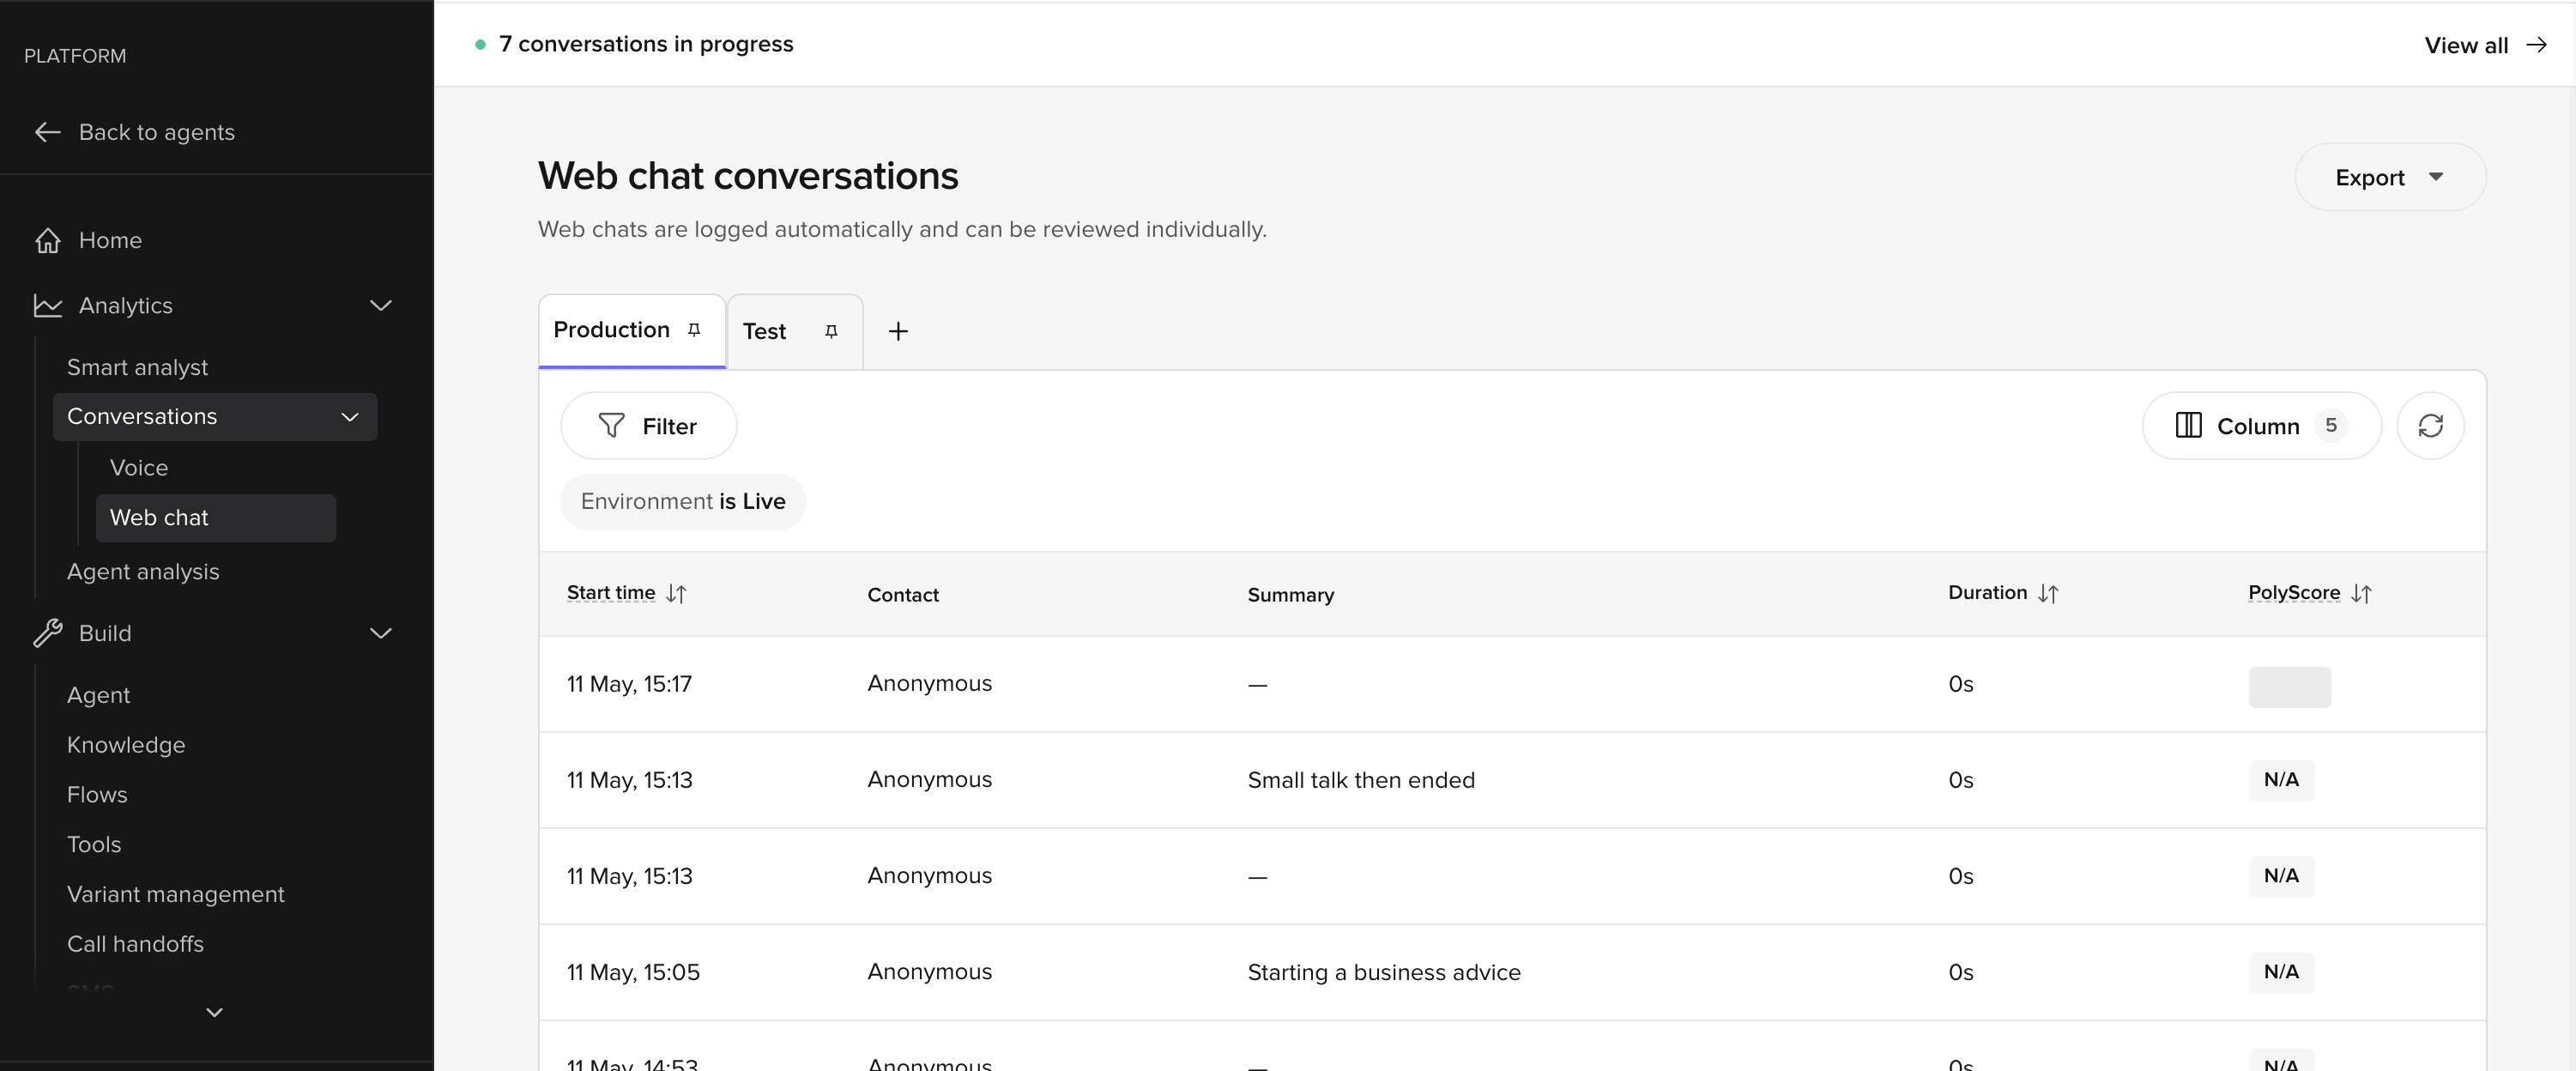
  <Frame caption="Web chat conversations page with the Production view pinned, an Environment is Live filter chip, and a 7 conversations in progress banner above the table">
    <img src="https://mintcdn.com/polyai/rSFEoR-hN0C8DJ2I/images/analytics/conversations-overview.png?fit=max&auto=format&n=rSFEoR-hN0C8DJ2I&q=85&s=955d42925df2bcac17a94e2a8a6532a3" alt="Web chat conversations page with the Production view pinned, an Environment is Live filter chip, and a 7 conversations in progress banner above the table" style={{ maxWidth: '720px', width: '100%', margin: '0 auto', display: 'block' }} width="3002" height="1248" data-path="images/analytics/conversations-overview.png" />
  </Frame>
</div>

<Frame caption="Conversation Review side panel showing the Transcription tab, four toolbar tabs, and a conversation transcript">
  <img src="https://mintcdn.com/polyai/rSFEoR-hN0C8DJ2I/images/analytics/conv-review-side-panel.png?fit=max&auto=format&n=rSFEoR-hN0C8DJ2I&q=85&s=06bf93e0259b62e80ef89fdf9169190d" alt="Conversation Review side panel showing the Transcription tab, four toolbar tabs, and a conversation transcript" style={{ maxWidth: '720px', width: '100%', margin: '0 auto', display: 'block' }} width="2490" height="1026" data-path="images/analytics/conv-review-side-panel.png" />
</Frame>

Use **Conversations** to inspect what actually happened on a conversation: transcripts, topic matches, function execution, and latency. When standard or [custom metrics](/settings/metrics) show a problem (containment dropping, safety flags rising), use this UI to diagnose the root cause.

<div className="full-only">
  Conversations is split into two scopes in the sidebar: **Voice** for voice calls and **Web chat** for webchat sessions. Both scopes share the same review, annotation, and diagnosis tools.
</div>

<div className="simplified-only">
  <Note>
    Every Web Calling call your agent handles is captured here as a transcript and recording. [Smart Analyst](/smart-analyst/introduction) is built into the [Agent Builder](/studio-assistant/introduction) home page as a chat panel, and [PolyScore](/analytics/polyscore) shows on the standard dashboard.
  </Note>
</div>

[Dashboards](/analytics/dashboards/introduction) show aggregate trends; Conversations is where you drill into the individual calls behind those numbers: what topics matched, what functions ran, what the LLM saw on each turn.

<Note>
  For QA workflows, see [QA and analytics](/learn/maintain/qa-analytics). For performance analysis, see [Performance monitoring](/learn/maintain/performance-monitoring).
</Note>

## Features

<CardGroup cols={2}>
  <Card title="Conversation review" icon="magnifying-glass" href="/analytics/conversations/review">
    Browse, filter, and inspect individual conversation transcripts, both live and completed. Export data for reporting.
  </Card>

  <Card title="Views" icon="table-columns" href="/analytics/conversations/views">
    Save and share filtered conversation lists as named views for recurring QA workflows.
  </Card>

  <Card title="Annotations" icon="tag" href="/analytics/conversations/annotations">
    Flag transcription errors or missing topics during review. Feeds a continuous improvement loop for ASR and your Knowledge area.
  </Card>

  <Card title="Conversation diagnosis" icon="stethoscope" href="/analytics/conversations/diagnosis">
    Toggle debugging layers to see conversation variables, flow paths, function calls, topic citations, and turn latency.
  </Card>
</CardGroup>

## Related pages

<CardGroup cols={3}>
  <Card title="Dashboards" icon="chart-line" href="/analytics/dashboards/introduction">
    See aggregate performance trends before drilling into calls
  </Card>

  <Card title="Smart Analyst" icon="sparkles" href="/smart-analyst/introduction">
    Surface patterns across conversations with natural-language queries
  </Card>

  <Card title="PolyScore" icon="star" href="/analytics/polyscore">
    Understand the automated quality score on each conversation
  </Card>
</CardGroup>