> ## Documentation Index
> Fetch the complete documentation index at: https://docs.poly.ai/llms.txt
> Use this file to discover all available pages before exploring further.
# Diagnosis
> Toggle diagnostic layers to inspect tool calls, flows, latency, and topic citations on the Transcription tab.
Use **Conversation Diagnosis** when you need to understand *why* the agent behaved a certain way on a specific turn – which tools ran, which topics were cited, and where latency occurred.
Diagnosis is a **toggle group** on the Transcription tab of the [Conversation review](/analytics/conversations/review) side panel. Switch any layer on or off to overlay extra information on each turn. Layers persist between conversations, so the views you care about stay enabled as you move through the table.
## Available diagnosis layers
### Conversation variables
Displays live variable values captured during the call (for example, booking IDs, customer names, flags), with diff markers when a variable changes turn-to-turn.
### Flows and steps
Tracks the agent's navigation through [flows](/flows/introduction) and steps, showing the execution path and the decisions made at each branch.
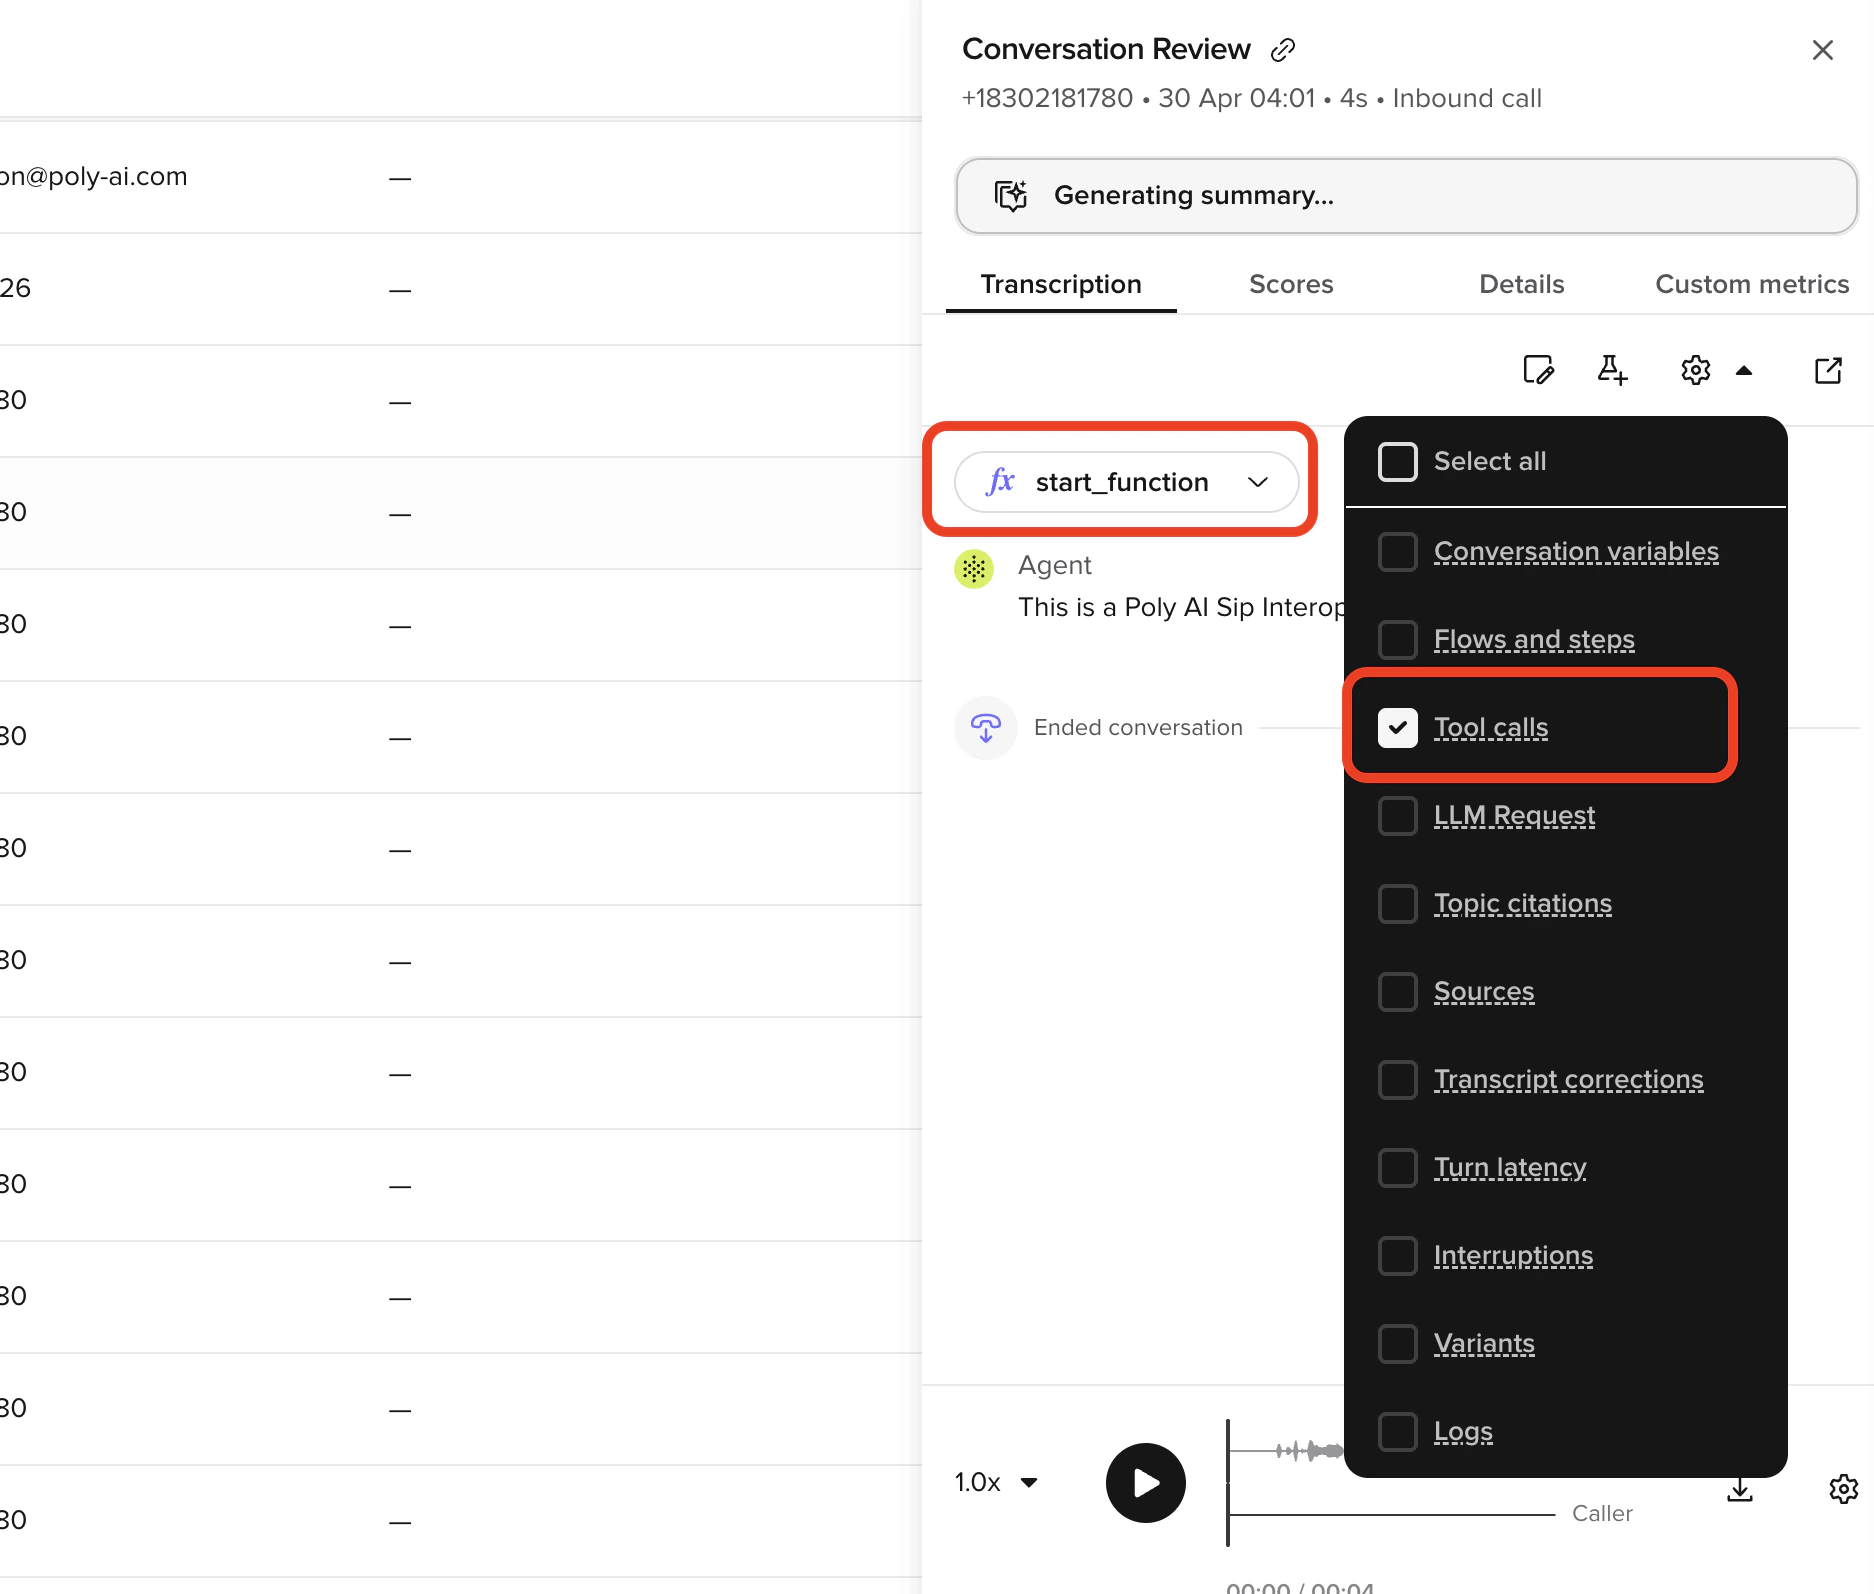
### Tool calls
Shows the [tools](/tools/introduction) the agent triggered during the call, including call parameters and outcomes.
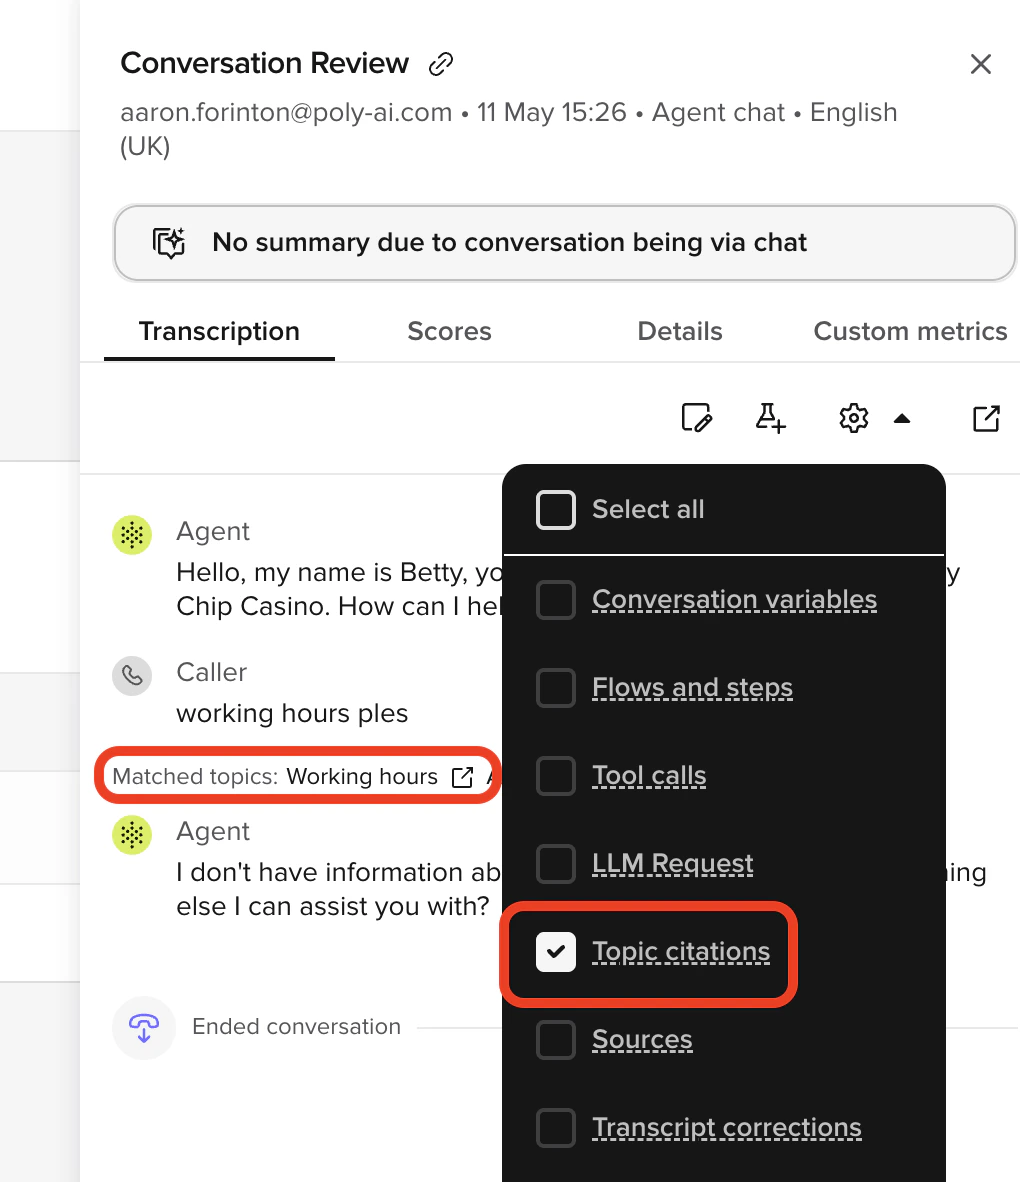
 ### Topic citations
Highlights the [Knowledge](/knowledge/faqs/introduction) topics the agent matched for each response.
### Topic citations
Highlights the [Knowledge](/knowledge/faqs/introduction) topics the agent matched for each response.
 ### Sources
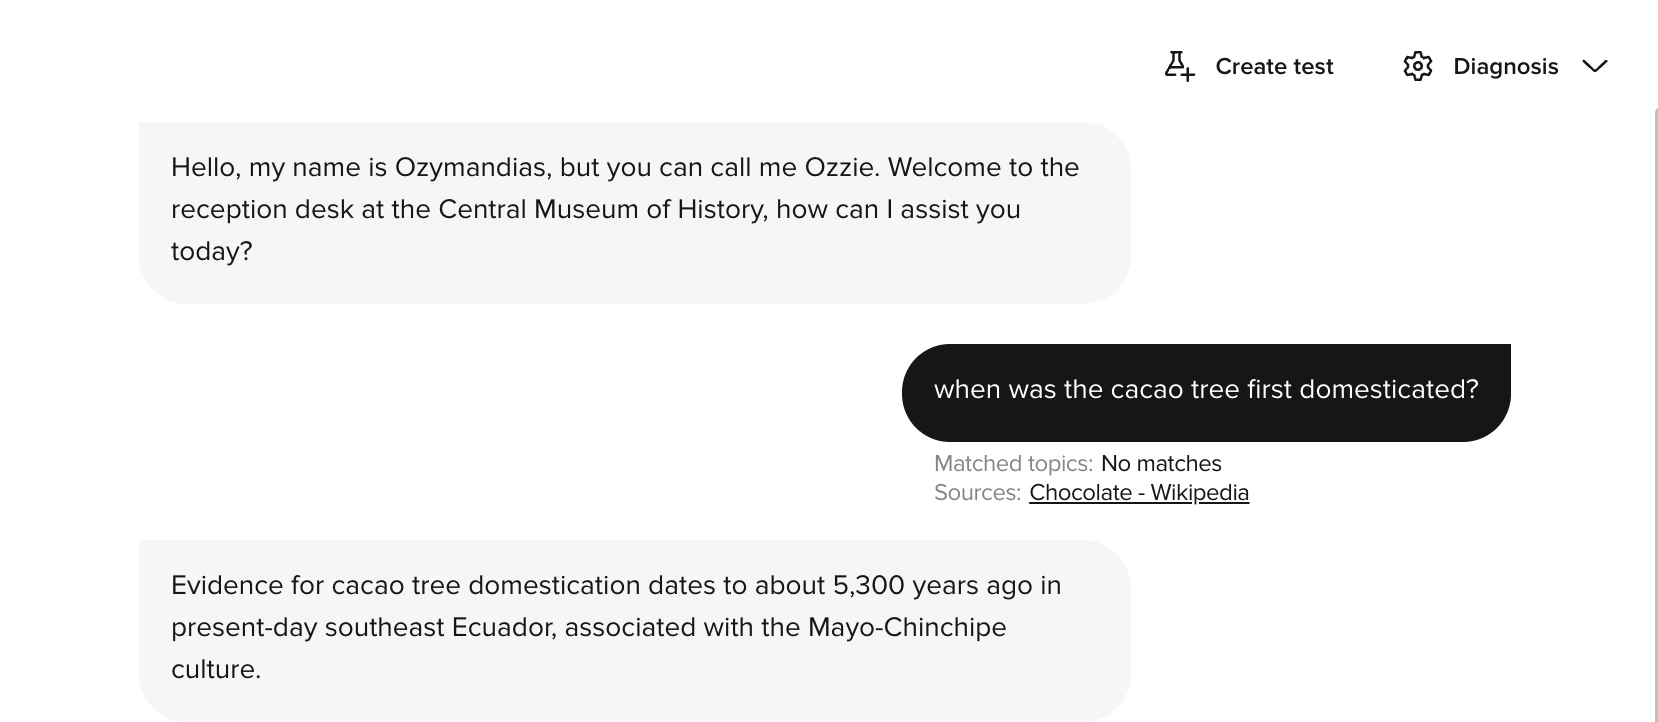
Shows which [Sources](/knowledge/sources/introduction) source files the agent retrieved for each turn. Click a source name to open an inline preview panel showing the retrieved content. Use **Open in Knowledge** in the panel to navigate directly to the source.
### Sources
Shows which [Sources](/knowledge/sources/introduction) source files the agent retrieved for each turn. Click a source name to open an inline preview panel showing the retrieved content. Use **Open in Knowledge** in the panel to navigate directly to the source.
 ### Transcript corrections
Displays where the automatic transcript was edited for clarity or accuracy. Use it to distinguish ASR errors from agent logic problems.
### Turn latency
Measures how long the agent took to respond at each turn.
Latency visualization includes component-level timing breakdowns.
#### Latency breakdown
When viewing turn latency, you can inspect timing for:
| Component | Description |
| ----------------------- | ----------------------------------------------------------------------- |
| **LLM requests** | Time spent waiting for the language model to generate a response |
| **Function calls** | Time spent executing functions, including API calls and data processing |
| **Total response time** | Combined time from user speech end to agent response start |
Use these breakdowns to:
* Identify slow function calls that need optimization
* Understand LLM response times for different query types
* Find bottlenecks causing user-perceived delays
* Compare latency across different conversation types
High LLM latency may indicate complex prompts that could be simplified. High function call latency often points to slow external API dependencies.
### Interruptions
Shows when the caller interrupted the agent, or when barge-in was detected. Use this to understand if caller behavior affected the conversation flow.
### Variants
Identifies which [variant](/knowledge/variants/introduction) handled each part of the call.
### Logs
Displays structured runtime logs emitted from your functions during the call. The Logs layer surfaces:
* Entries from [`conv.log.info()`, `conv.log.warning()`, and `conv.log.error()`](/tools/classes/conv-log).
* API response logs from [`conv.log_api_response()`](/tools/classes/conv-object#log_api_response).
Use the Logs layer to debug function behavior, track external API responses, and correlate runtime events with what the caller experienced. See [Conversation log](/tools/classes/conv-log) for the full `conv.log` API.
### Entities
Lists **extracted entities** captured from the user, like booking numbers, account IDs, or city names. Especially useful in transactional scenarios where the agent needs to capture structured data from free text.
## Using diagnosis for optimization
Combine multiple layers to understand agent behavior:
1. Enable **Turn latency** to identify slow responses.
2. Check **Tool calls** for those turns to see if external calls are causing delays.
3. Use **Sources** to verify the content the agent retrieved from Sources.
4. Use **Flows and steps** to confirm the agent followed the expected path.
5. Use **Logs** to read structured `conv.log` output and API response payloads emitted by your functions.
## Related pages
Full conversation analysis across voice and webchat.
The `conv.log` API that powers the Logs diagnosis layer.
Ongoing performance management workflows.
### Transcript corrections
Displays where the automatic transcript was edited for clarity or accuracy. Use it to distinguish ASR errors from agent logic problems.
### Turn latency
Measures how long the agent took to respond at each turn.
Latency visualization includes component-level timing breakdowns.
#### Latency breakdown
When viewing turn latency, you can inspect timing for:
| Component | Description |
| ----------------------- | ----------------------------------------------------------------------- |
| **LLM requests** | Time spent waiting for the language model to generate a response |
| **Function calls** | Time spent executing functions, including API calls and data processing |
| **Total response time** | Combined time from user speech end to agent response start |
Use these breakdowns to:
* Identify slow function calls that need optimization
* Understand LLM response times for different query types
* Find bottlenecks causing user-perceived delays
* Compare latency across different conversation types
High LLM latency may indicate complex prompts that could be simplified. High function call latency often points to slow external API dependencies.
### Interruptions
Shows when the caller interrupted the agent, or when barge-in was detected. Use this to understand if caller behavior affected the conversation flow.
### Variants
Identifies which [variant](/knowledge/variants/introduction) handled each part of the call.
### Logs
Displays structured runtime logs emitted from your functions during the call. The Logs layer surfaces:
* Entries from [`conv.log.info()`, `conv.log.warning()`, and `conv.log.error()`](/tools/classes/conv-log).
* API response logs from [`conv.log_api_response()`](/tools/classes/conv-object#log_api_response).
Use the Logs layer to debug function behavior, track external API responses, and correlate runtime events with what the caller experienced. See [Conversation log](/tools/classes/conv-log) for the full `conv.log` API.
### Entities
Lists **extracted entities** captured from the user, like booking numbers, account IDs, or city names. Especially useful in transactional scenarios where the agent needs to capture structured data from free text.
## Using diagnosis for optimization
Combine multiple layers to understand agent behavior:
1. Enable **Turn latency** to identify slow responses.
2. Check **Tool calls** for those turns to see if external calls are causing delays.
3. Use **Sources** to verify the content the agent retrieved from Sources.
4. Use **Flows and steps** to confirm the agent followed the expected path.
5. Use **Logs** to read structured `conv.log` output and API response payloads emitted by your functions.
## Related pages
Full conversation analysis across voice and webchat.
The `conv.log` API that powers the Logs diagnosis layer.
Ongoing performance management workflows.